


Price Bounce or Falling Knife

A trending stock you have been stalking drops in price. It’s exciting and seems like a great opportunity but is it really? There is one particular technical indicator I like to use as a reality check. It zooms in on price action, showing where price is likely to head over the shorter-term.
Heikin-Ashi Indicator
This trend indicator is a useful tool for identifying specific trend changing candles on a chart.
Heikin-Ashi means average bar in Japanese. A Heikin-Ashi candle looks very similar to the traditional Japanese candle charts most readers are used to. The traditional Japanese candles use actual price to plot the open, close, high and low of each candle while Heikin-Ashi candles use an average of price from previous sessions to plot the open, close, high and low of each candle. By using average price, volatility is smoothed out and false signals are avoided, particularly when it comes to identifying trend.
Signs of a turning point, occur when a particular candle changes colour from red to green for the upside or green to red for the downside.
Positive Criteria for a Potential Bounce include:
1. GMMA uptrend in place
2. Investors are supportive as indicated by the widely separated long-term exponential moving averages in the long-term GMMA
3. Pullback to the lower edge of the short-term GMMA or upper/lower edge of the long-term GMMA. They are often good areas to look for a price bounce
📈🔴CHART 1
Findi Limited - FND met all the criteria mentioned above for a potential bounce. The price pullback was a significant one where price ended the day down 23.7%. It seemed like a good time to buy but we needed to assess if price had further to fall. This is the method I used for deciding if this was a falling knife or a stock to watch for a good entry.
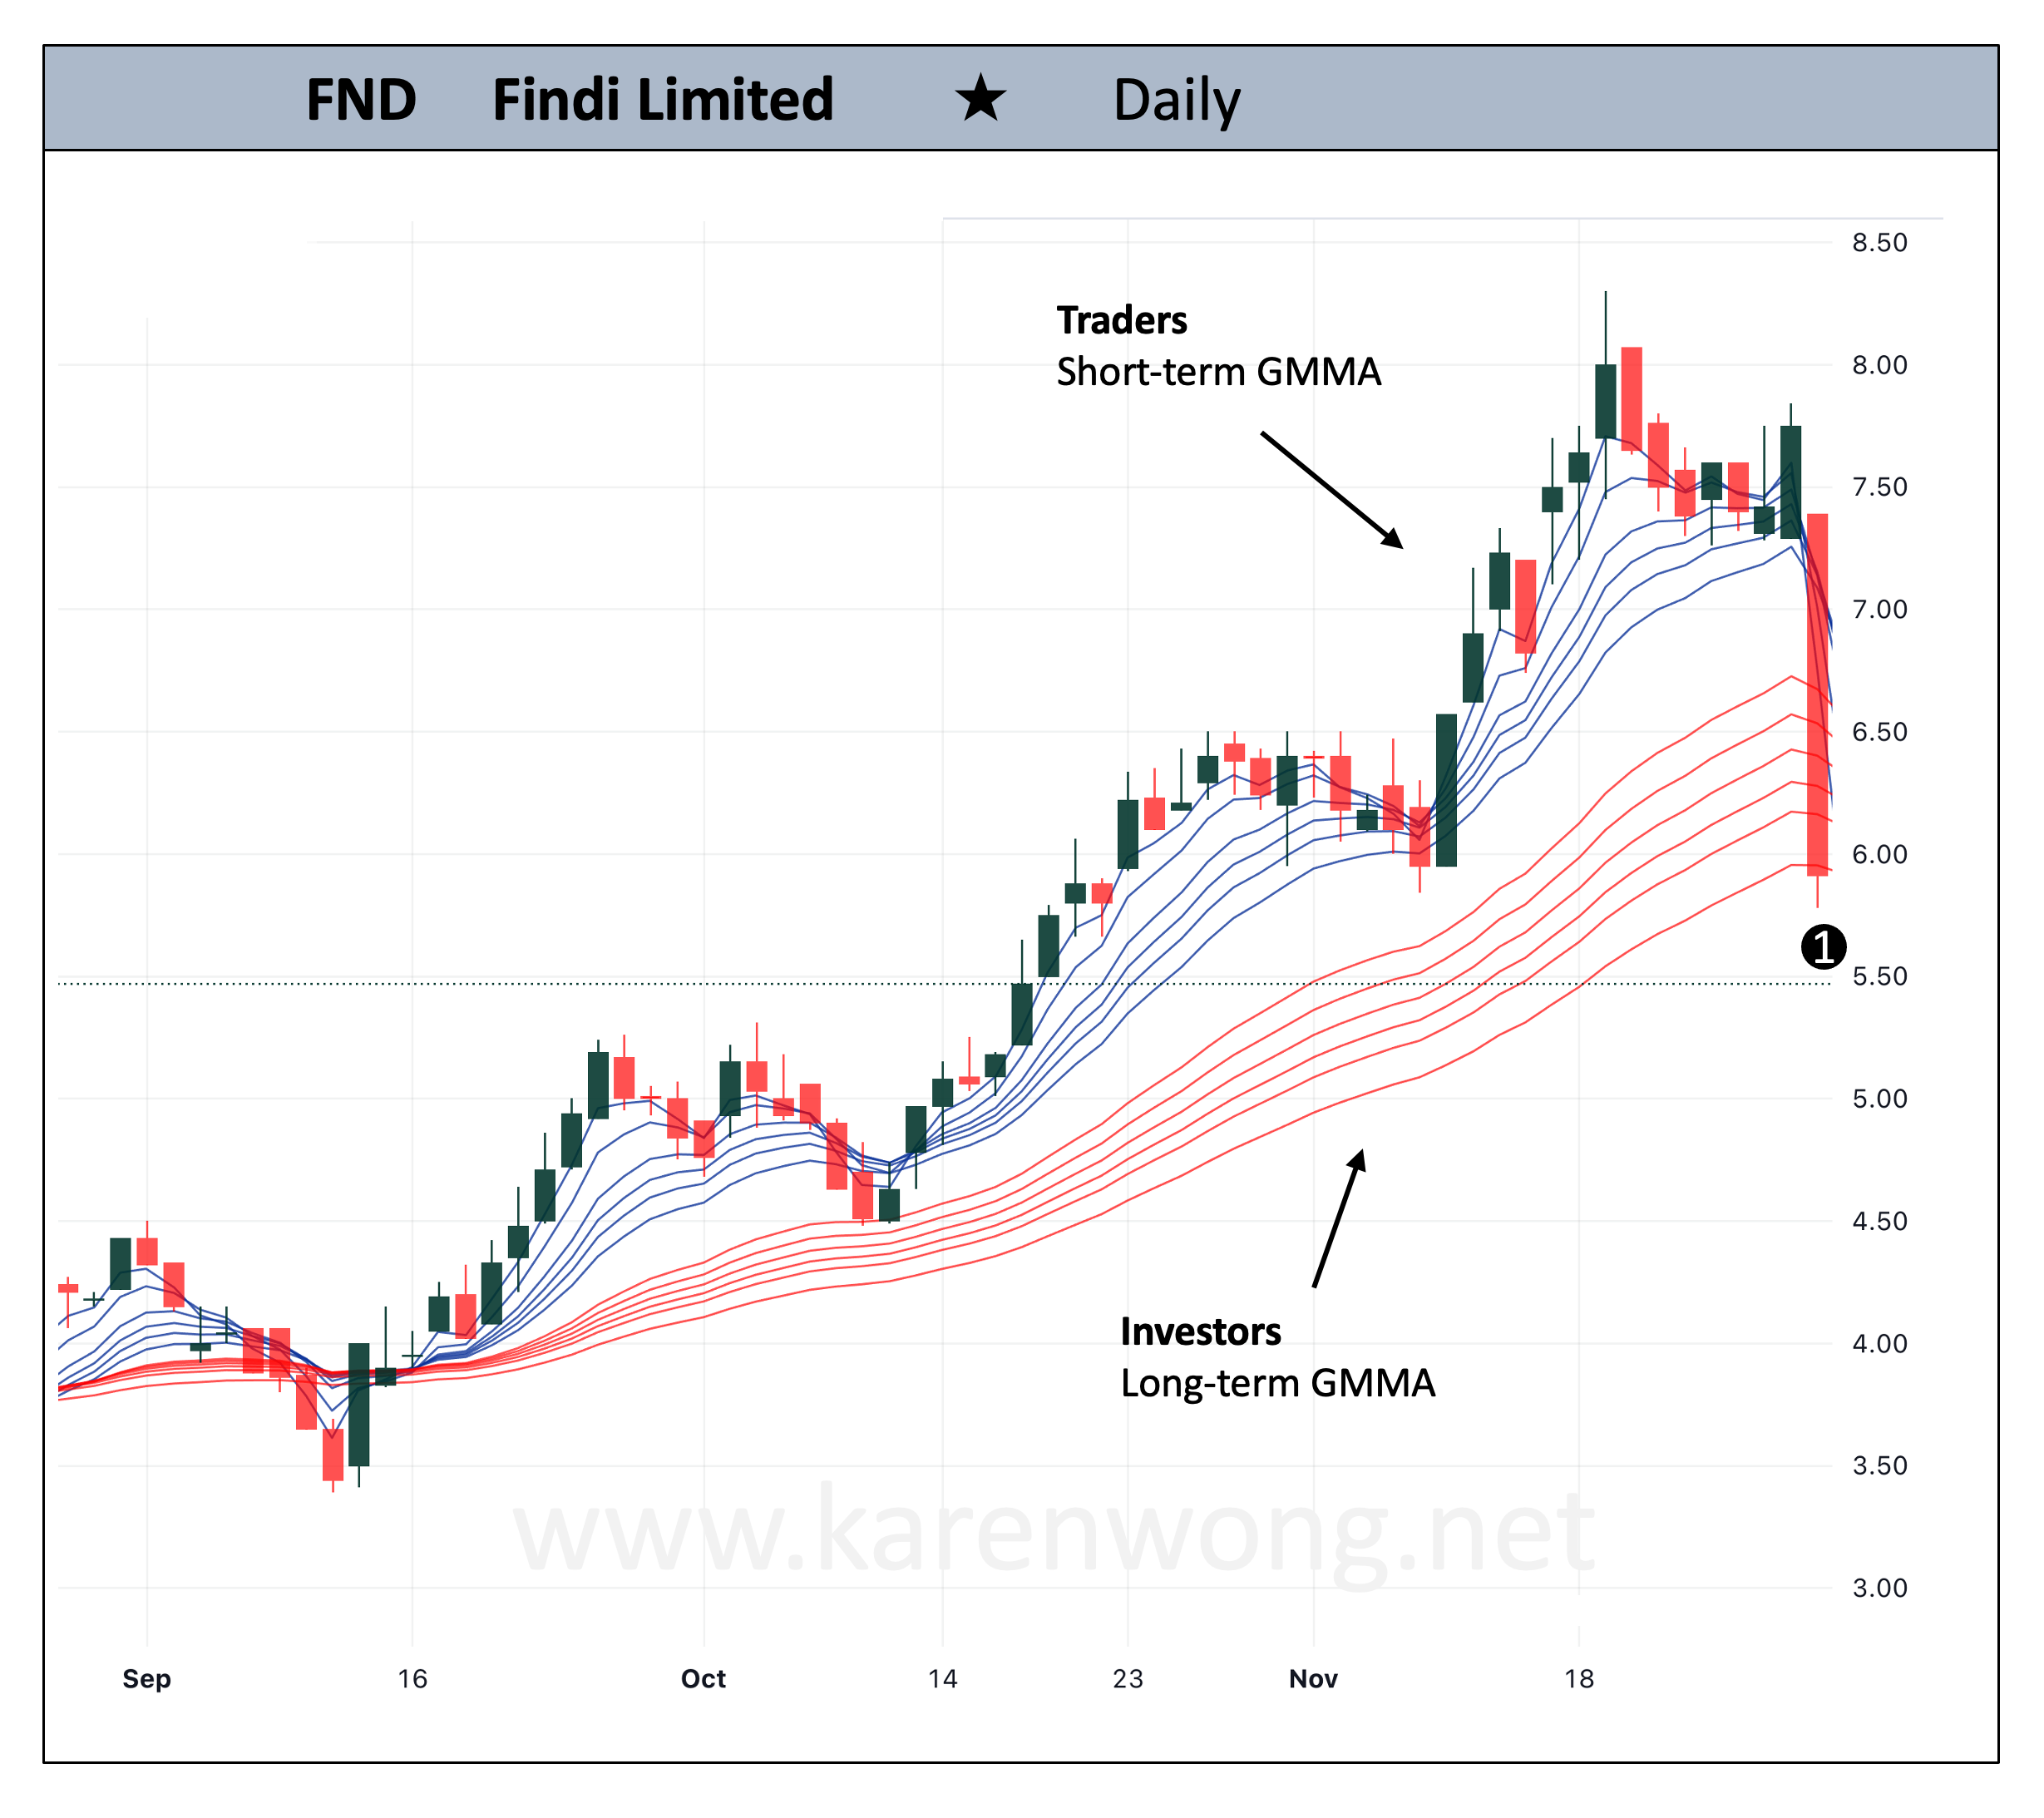
The lower edge of the long-term GMMA appeared to be a good place for a price bounce.
Alongside the price fall, the short-term GMMA had compressed and turned downwards. Traders were selling down the stock.
In order to analyse the price action further, the standard candlestick chart was changed to a Heikin-Ashi candlestick chart.

Fake Opportunities
On the FND Heikin-Ashi candlestick chart, Heikin-Ashi candle number 1 had turned red on the day of the dramatic fall. The trend according to the Heikin-Ashi indicator had changed from an uptrend into a downtrend.
Candle number 2 was the first green candle on the standard candlestick chart (not shown) but was red on the Heikin-Ashi candlestick chart. A row of red candles indicated a downtrend in place. The downtrend was confirmed further as the short-term GMMA passed down through the long-term GMMA, breaking the uptrend order.
At this point on the chart, price behaviour seemed more like a falling knife than a potential bounce.
📈🟢CHART 2
On the chart of James Bay Minerals - JBY we identify the 3 positive criteria points for a potential bounce – GMMA uptrend, widely separated exponential moving average lines in the long-term group and a pullback to the upper edge of the long-term GMMA as marked by the arrow.

Looking at the area of the bounce how do we know this is a high probable bounce and not a falling knife? Overlaying the Heikin-Ashi candles onto the chart gives us further clues.
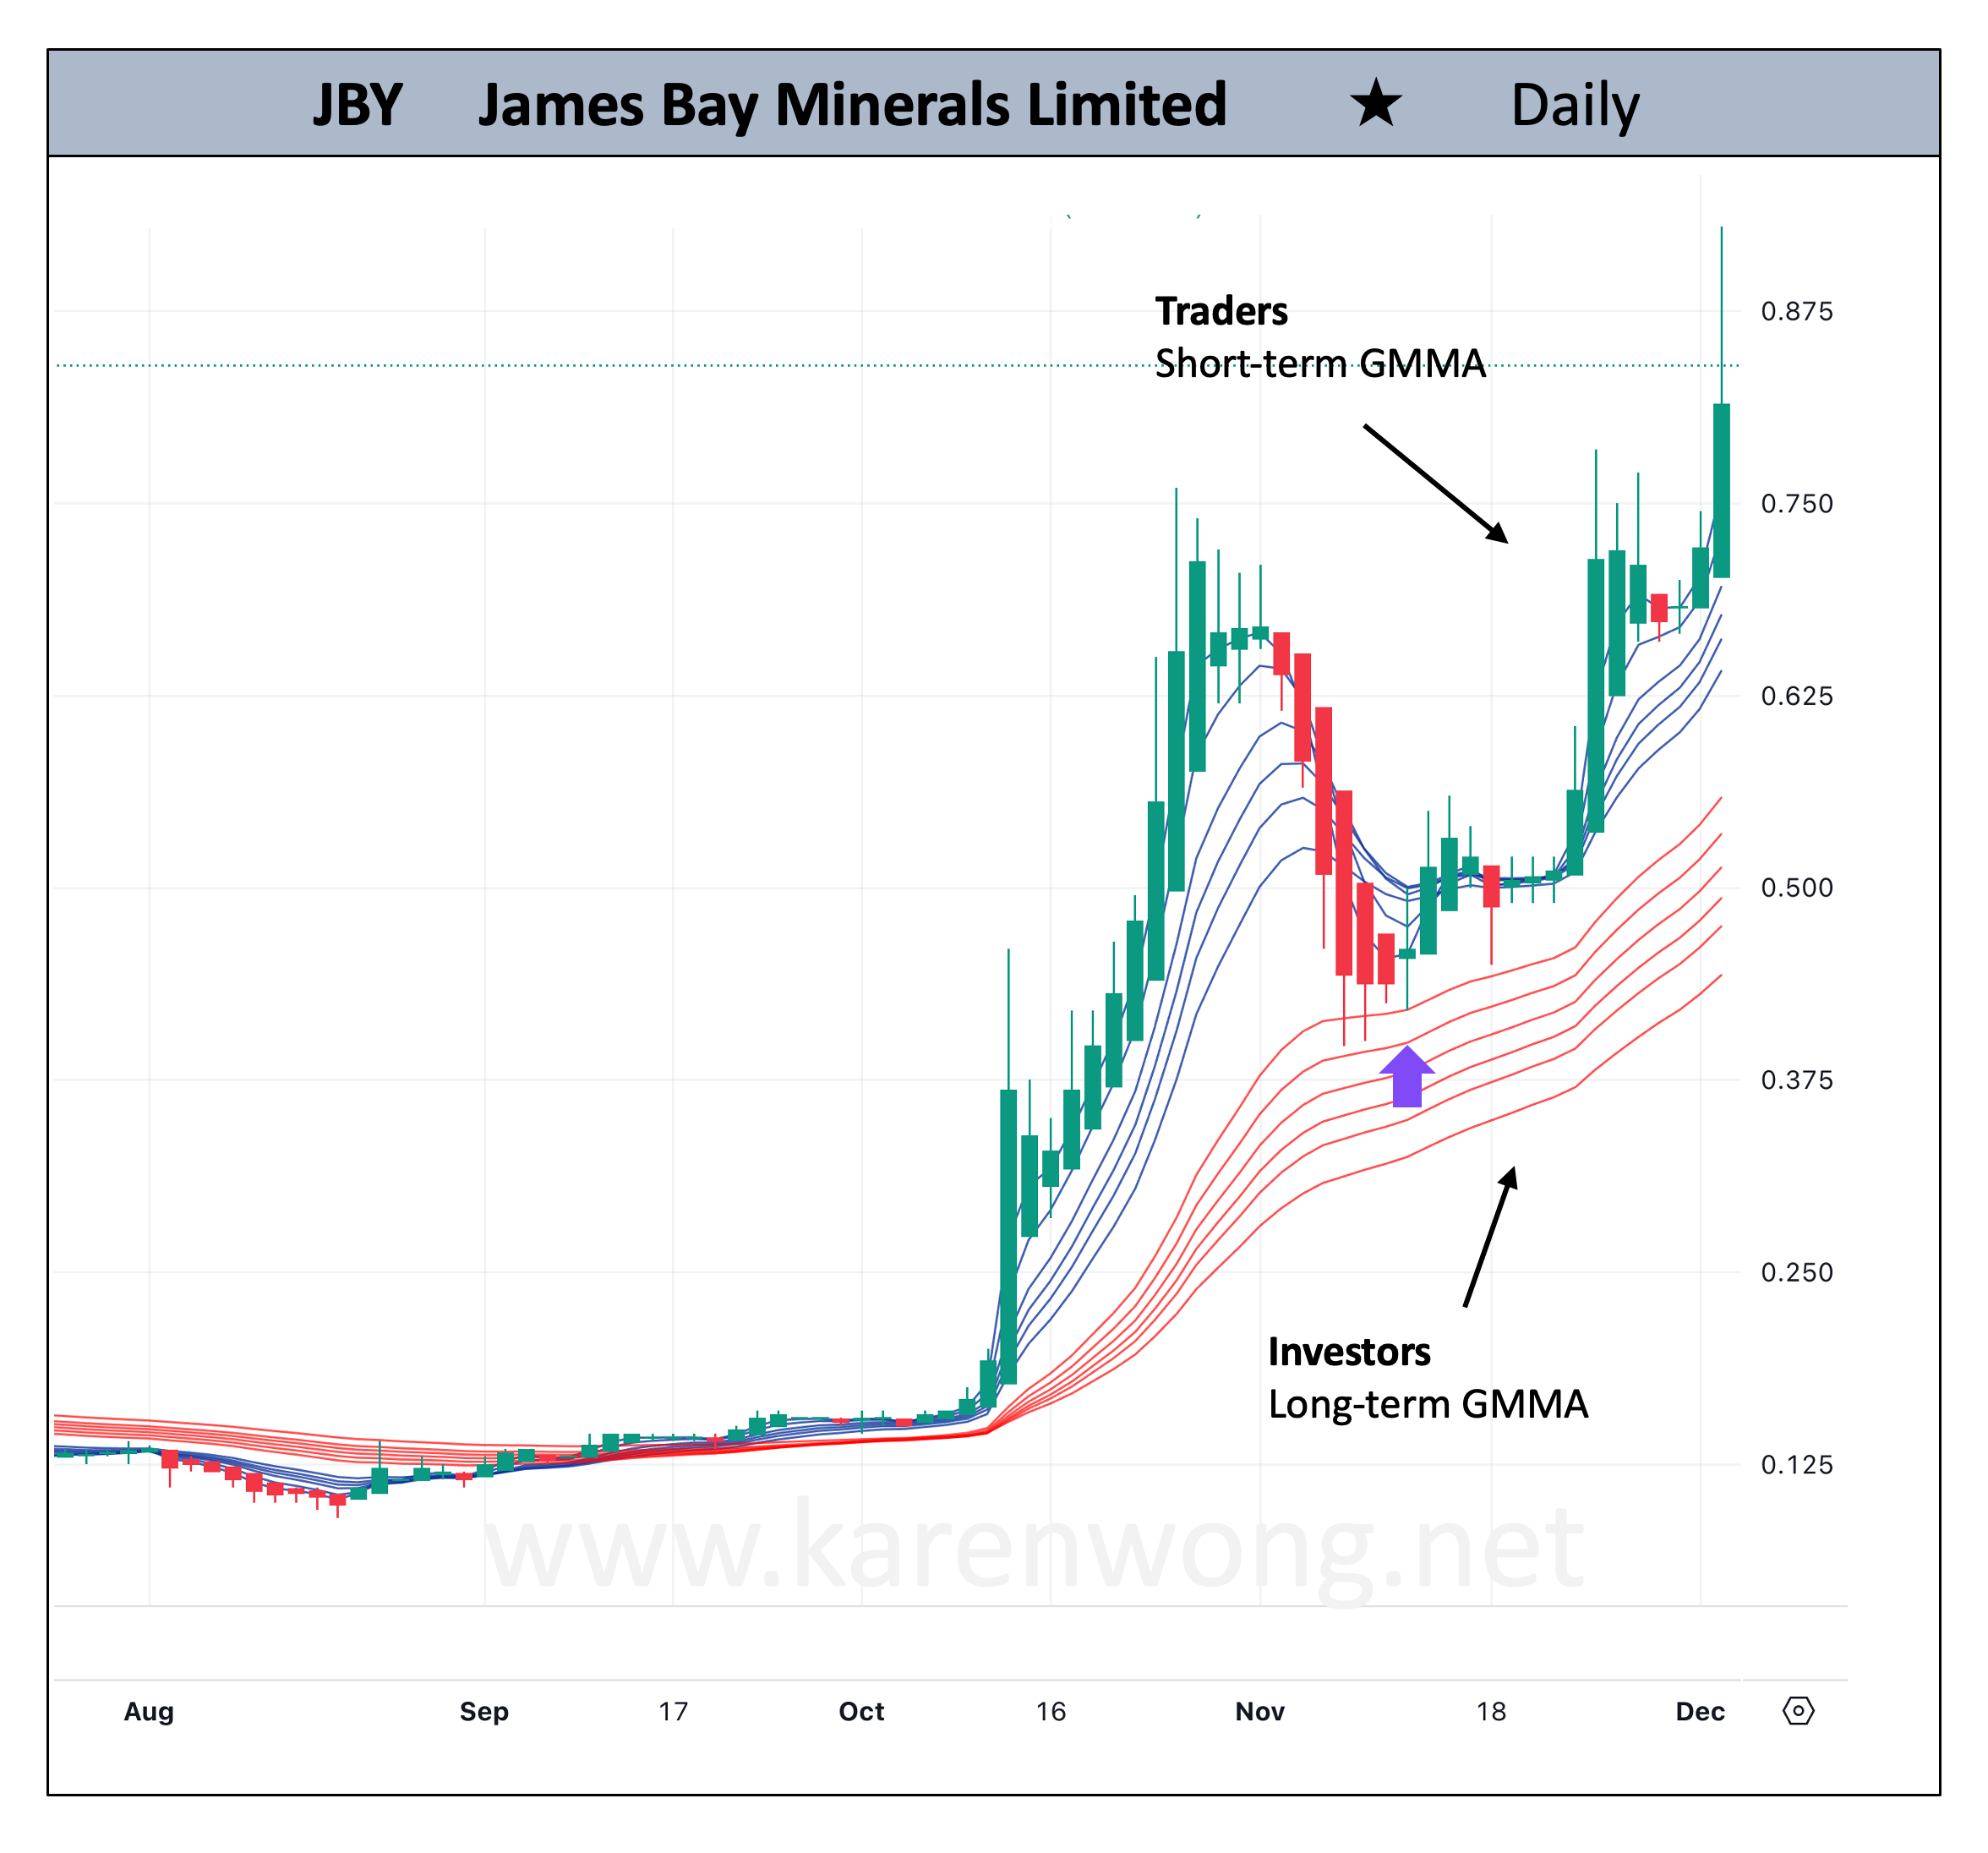
On the day of consideration, marked by the arrow, the Heikin-Ashi candle had turned green and over the next day another green candle formed. Price doesn’t immediately take off but it doesn’t fall further. The long-term GMMA group was well supported by investors and provided a good foundation for the GMMA uptrend. Price eventually moved upwards as the short-term GMMA lines expanded out from compression.
The Heikin-Ashi indicator is not a stand-alone indicator. Once a positive signal is identified, we still need to confirm the direction of price with other technical indicators. It’s a good starting point when making an entry decision after a pullback in price.
once again Karen you have made it clear iam going to follow up on the Heikin ashi canndels every thing else does not seam to be working Thanks again Maurie
Hello Karen have you got the hikin ash candels on the guppy charts as i do not seam to find them any where , an y help appreciated thanks again Maurie