No two market crashes happen in exactly the same way. It’s difficult to predict a major crash though the warning signs often flash at us continuously for weeks. Here are some of those warning signs calling for extra caution and to be on high alert for managing our trades.
Trend Break on the Daily Chart
Searching for signs of the bear starts with a market index chart. In this case, the XJO known as the ASX 200, an index of the top 200 Australian stocks on the market.
The index is like a compass pointing in the direction of where the market is headed. Watching the portfolio balances alone will only trigger emotion followed by panic.
On the daily chart of the XJO at the time of writing, the most recent uptrend leg had broken. The short-term GMMA group had passed downwards over the long-term GMMA group as traders sold off their stocks. The long-term moving average lines were compressed, signalling agreement. Any expansion of this group to the downside will reflect the activity of investors who are also joining in the sell off.
Daily charts are closer to price action and reveal the market sentiment on a daily basis.
The problem with daily charts is they contain a lot of price action noise. For a better picture of the long-term, the weekly chart is preferred for a longer-term view. We don’t ignore the daily chart alerts. It serves as an early signal, making us hypervigilant of the potential for the weekly chart to turn down in the same direction.
Stop Losses/Trailing Profit Stops Triggered
My preferred stop loss indicator is the Average True Range ATR line. I use a 2 times ATR allowing a stock’s price to move, up to twice the amount it normally would over one day. Should price close beneath the line it means price has moved outside of normal volatility and indicates the trend has changed.
Obeying a stop loss signal such as the ATR indicator and closing out trades should be seriously considered. Especially when the daily chart has broken its uptrend.
As the index breaks down on the daily, a stop loss indicator such as the ATR may trigger a stop for some stock positions. Closing a trade minimises loss or preserves profit in the case of a trailing profit stop loss.
Taking Profits
For any remaining open trades, I may consider taking profit if the market index is falling not only on the daily index chart but on the weekly index chart too.
A weekly chart like this XJO chart is not a reassuring chart despite the uptrend still in place. The short-term moving averages have rolled over towards the downside.
Profit taking provides some peace of mind when the index is in a state of uncertainty.
Lessons from the GFC and COVID 2020 Market Crashes
In 2008, the XJO weekly chart signalled a change in trend when the short-term GMMA crossed down and over the long-term GMMA group. The uptrend had ended and the downtrend started to develop. It wasn’t a sudden ‘crash’, it was a downtrend lasting many months, where there were opportunities for closing short-term trades along the way. It took over a year to reach the bottom area around 3120.
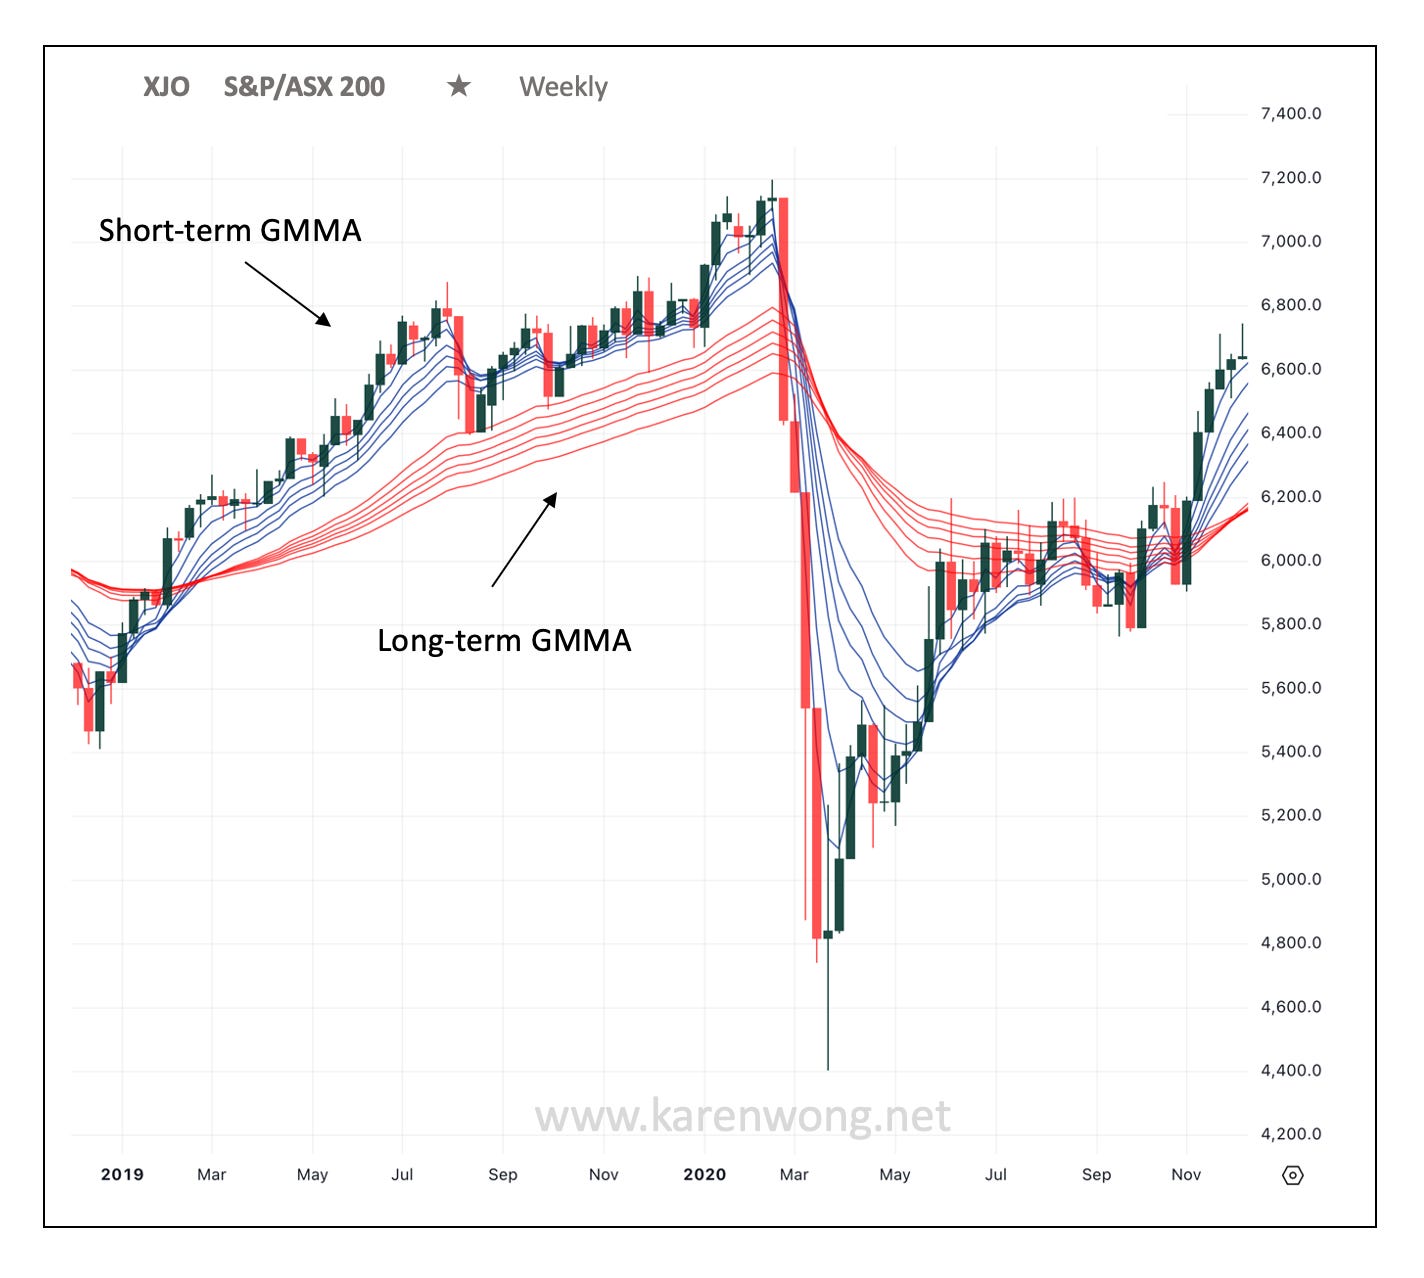
In 2020, the COVID crash warning signs on the weekly showed the GMMA uptrend ending as the short-term GMMA crossed down through the long-term GMMA. There was enough time to close trades over the next couple of weeks as the downtrend began.
Opportunity Cost of Keeping Trades Open
Holding onto a trading stock through a bear market is not ideal as a trader. We need capital to take on trading opportunities.
How long do bear markets last?
This chart from Bloomberg up until June 2022 showed recovery of the S&P 500 resulting from the GFC crash had been 1009 days. The fastest recovery was 103 days from the COVID crash.
History showed how the COVID recovery was an exception. The wait might be over 1000 days for stocks to recover. It’s a long wait and a long time for capital to be locked up.
A market index like the XJO is useful as a compass for assessing the market’s direction. From the daily and weekly index charts, we are able to extract information and make better trade management decisions on whether to hold, take profits or cut losses.


Thanks for your advice and time