Holding Back from a Buying Frenzy
Over the last few weeks, buying silver stocks had everyone talking. On one particular day, many silver stocks gapped up on the open and closed the day on double digit percentage rises. For those already holding it’s a big bonus. For those still on the sidelines it might be better to look for entry opportunities at a later date.
Some wise shoppers like to apply a 7 day rule for purchasing an item. It means waiting for one week before deciding to buy. It’s a guard against impulse buying and getting caught up in the high of the moment. For stocks fuelled by impressive price movements, I also like to wait before making a buy decision.
Before clicking the buy button, look out for these 2 chart scenarios where price has a higher probability of pulling back. Delaying the buy decision may lead to better entry areas at a later date.
1. Spike day
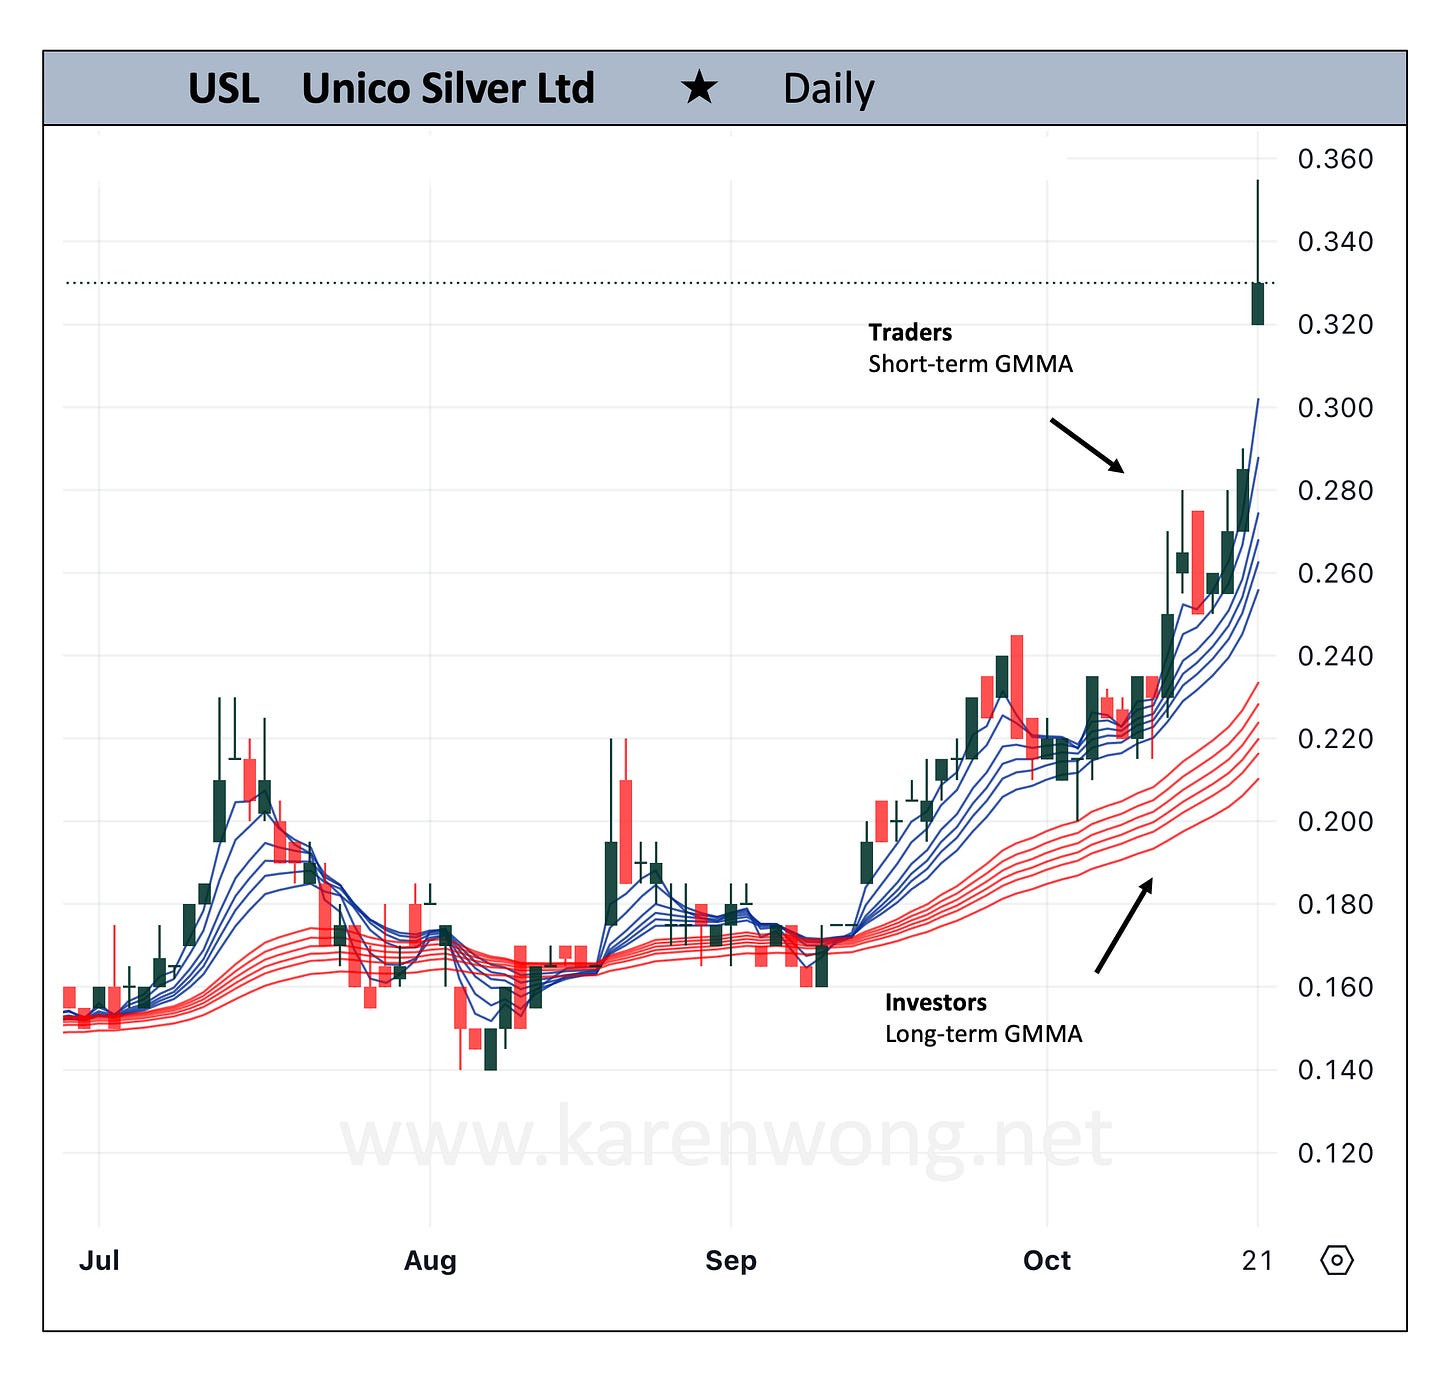
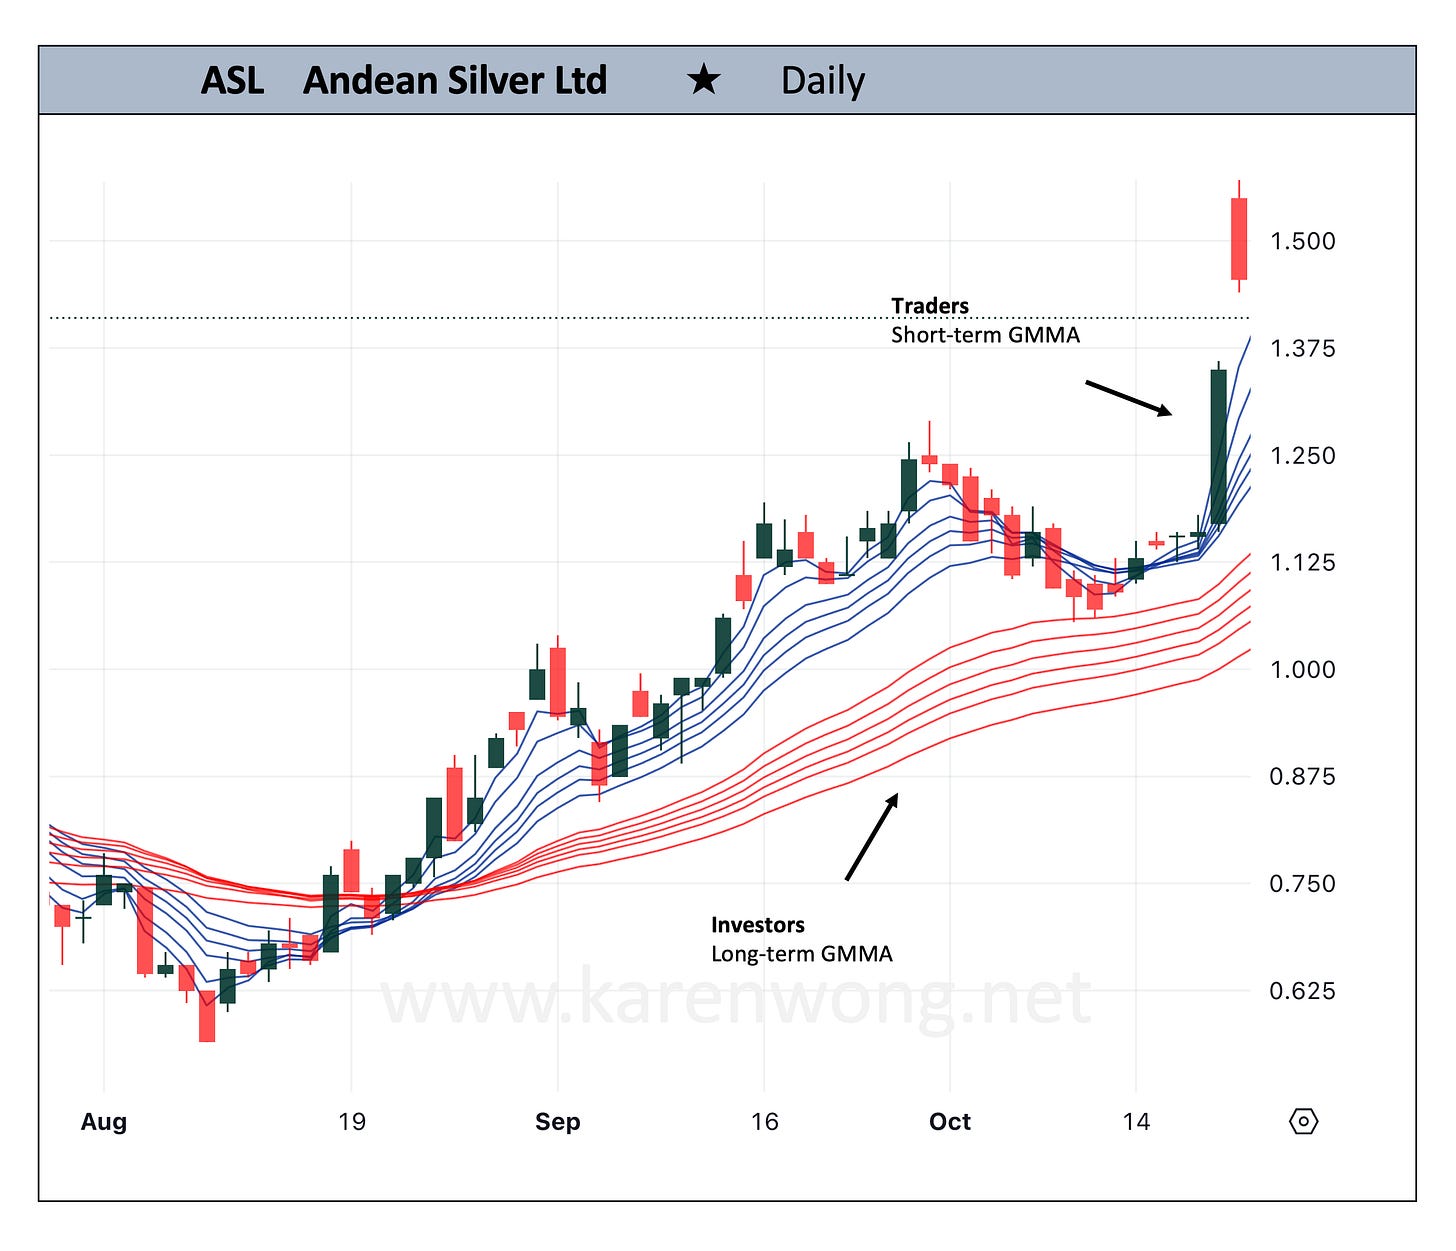
This is the type of day triggering a FOMO reaction from the market. Price climbs higher as traders pile in. A double digit one day percentage rise, especially one with a gap up is automatically a red flag for me.
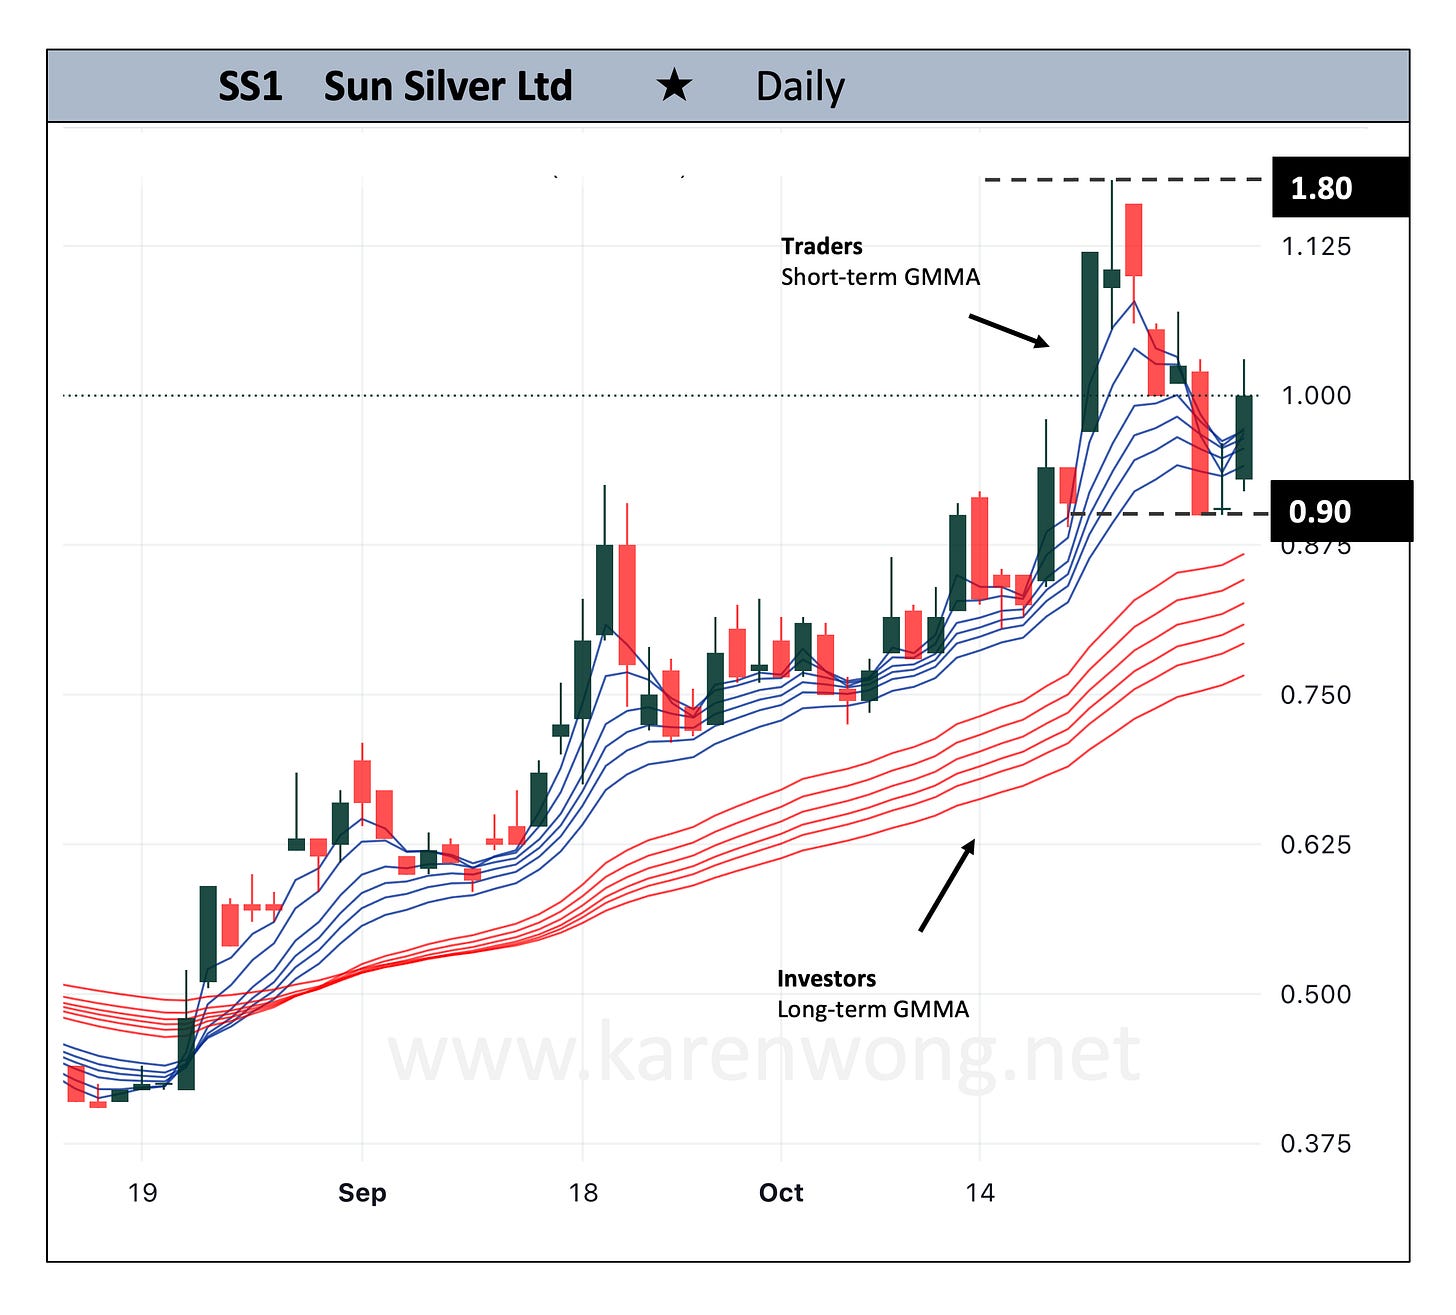
📈⚠️ Price of SS1 spiked 23.08%
📈⚠️ Price of USL on the same day gapped and ended the day up 15.8%
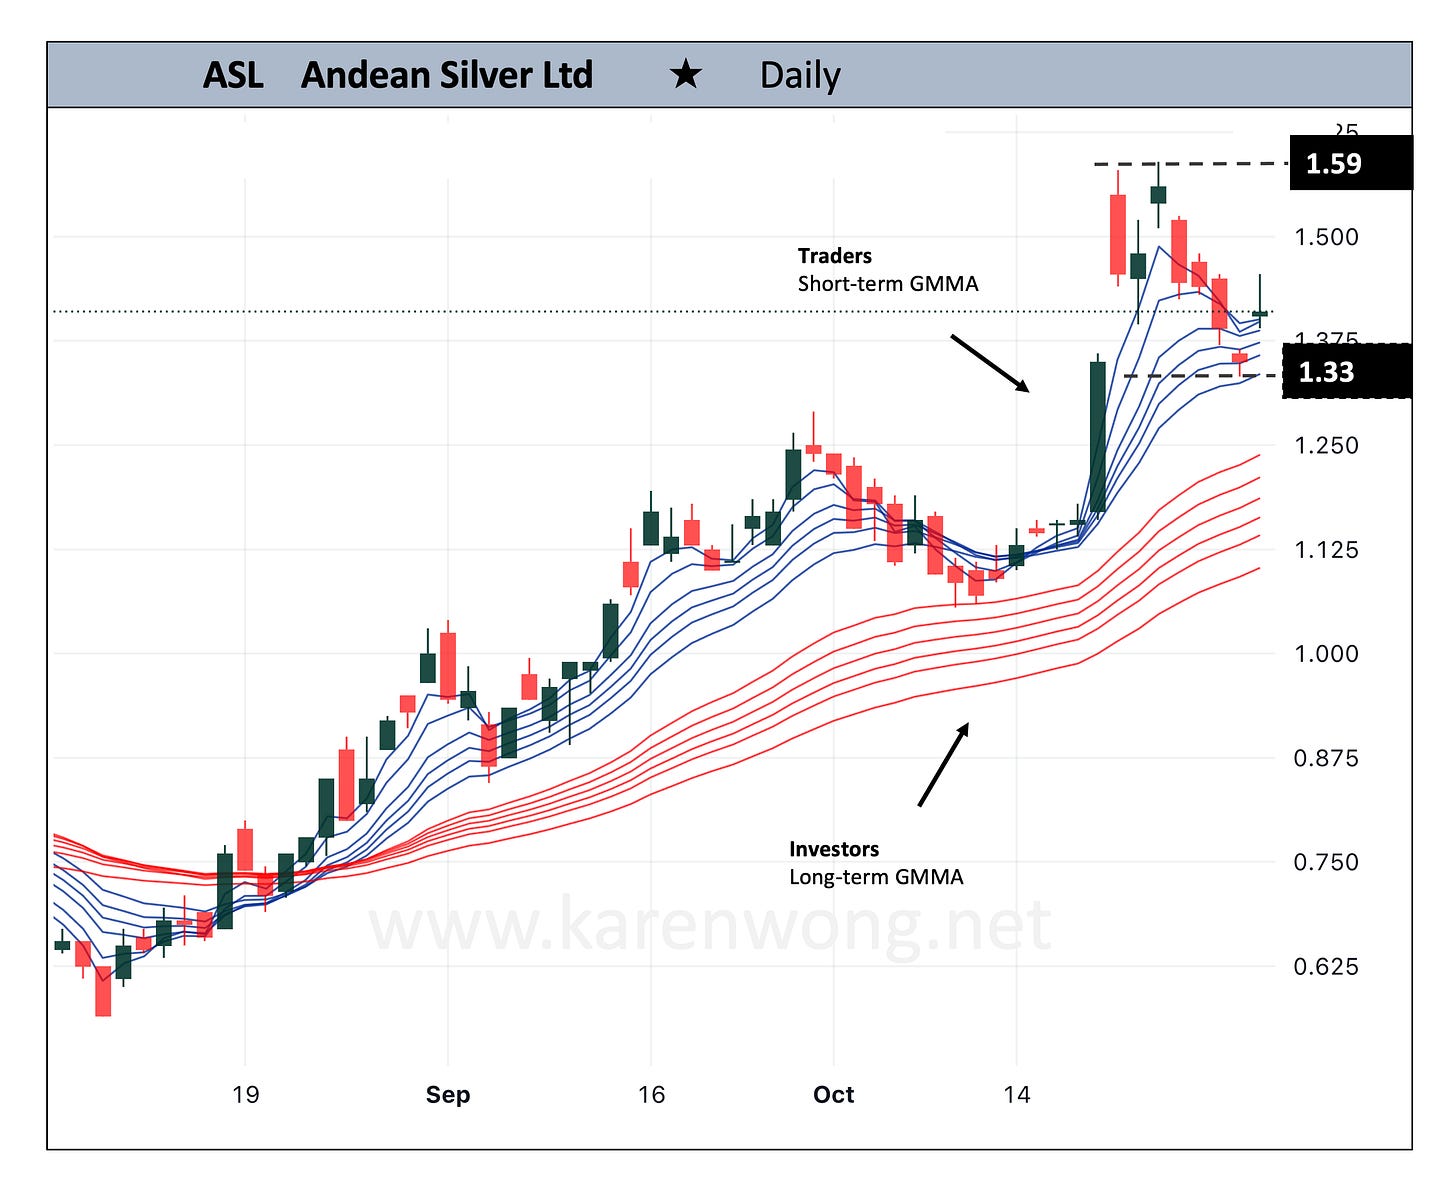
📈⚠️ Price of ASL gapped up, ending the day up 7.8%
These areas of the chart are not ideal entry points. Joining in the bidding frenzy increases the risk of buying at the top.
🚩 Spikes in price like this are prone to a drop
2. Established trend leg
If an uptrend leg has already developed, price may pullback at any time. Especially in an existing GMMA uptrend where traders/investor buying is strong, signalled by the widely separated exponential moving averages of the GMMA groups.
On the charts of USL, SS1 and ASL, the investor foundation of the uptrend had been strong.
Any future sell off or pullback in price has a high probability of becoming a temporary pullback before resumption of the dominant uptrend.
🚩 We may have missed most of the move for the current leg but there is potential for another opportunity should a pullback occur within the ongoing uptrend.
WAITING FOR A CONFIRMATION BOUNCE
We like to see price pull back and reject either of the
- Lower edge of short-term GMMA
- Upper edge of long-term GMMA
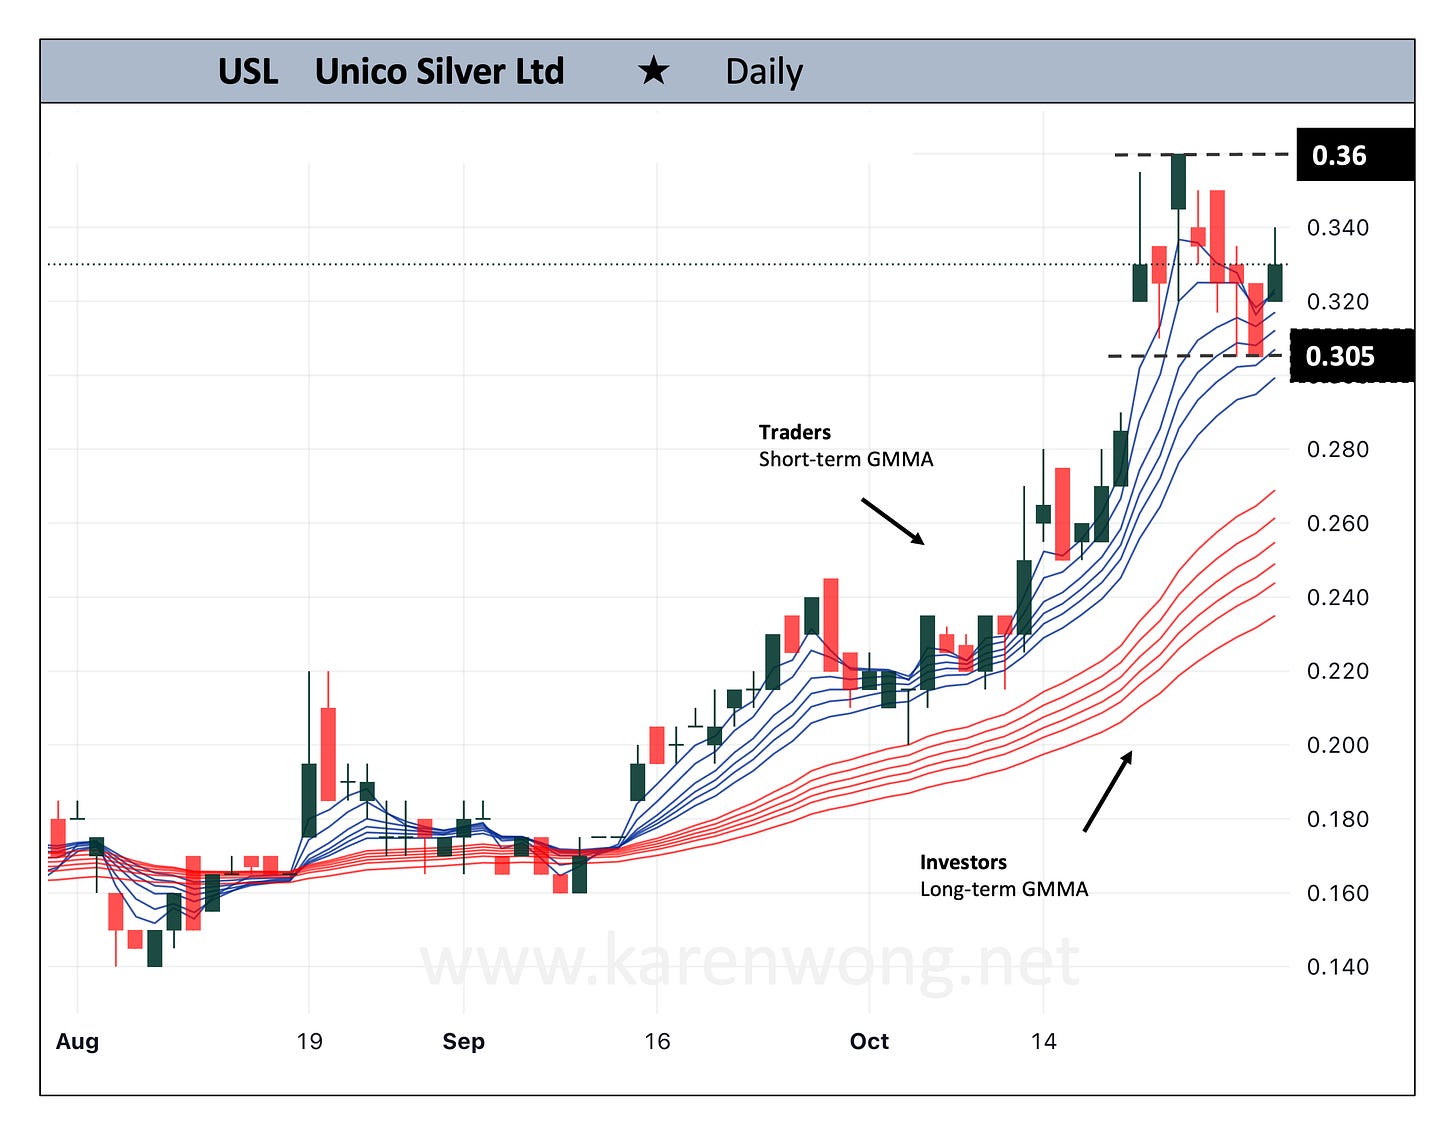
A focus on the last candle of the SS1, USL and ASL charts showed early signs of rejection and a potential turnaround. Price was starting to rise again.
Price of SS1 up 10.5%
Price of USL up 8.2%
Price of ASL up 4.4%
🚩 Always err on the side of caution as price approaches the lower edge of the short-term GMMA or the upper edge of the long-term GMMA. Rejection of the GMMA area should be confirmed by other technical indicators before entering into a position.
Stops losses are essential for capital protection, particularly against the possibility of price falling through the short-term or long-term GMMA group.
On the charts of SS1, USL and ASL, price reached a high before making its expected price retracement. At the time of writing, this retracement area on the chart was better for a lower priced entry than at the time of the frenzied buying. A preferred result from holding back, letting emotions fade and the frenzy pass.


