Gold’s Turning Point
Gold has been trending strongly for many months, making it over the 5000 level recently. Some gold stocks followed suit and as the trend continued, some price dips were better buying opportunities than others. Let’s look back to see when the uptrend in gold started to emerge, a few of stocks of interest and where the price of gold might go in the future.
On the weekly chart of gold, the GMMA uptrend began around the start of 2023. Long-term holders began accumulating as the exponential moving averages separated in the long-term group. By July 2023, the short-term traders were in agreement of price as indicated by the compression of the short-term moving averages.
Trader buying activity increased around March 2024. The moving averages expanded out of compression in the short-term group and the widening gap between the short and long-term group indicated good strength in the emerging uptrend. At 3800, price formed a support/resistance level, once broken the gold uptrend continued strongly.
Identifying Buying Opportunities
Not all gold stocks are automatically buying opportunities. Searching for gold stocks trending in line with the gold chart breakout of March 2024 required analysis of each potential stock separately. This is the key to finding better trades.
DEG De Grey Mining – Not every gold chart glitters
A bearish RSI divergence at the beginning of 2023 saw the DEG stock price turn down with traders and investors losing interest as the moving averages compressed in both groups.
Around March 2024 when gold was rising, this stock’s trend continued downwards. This stock was not seen as a high probability trade at the time of the breakout of March 2024.
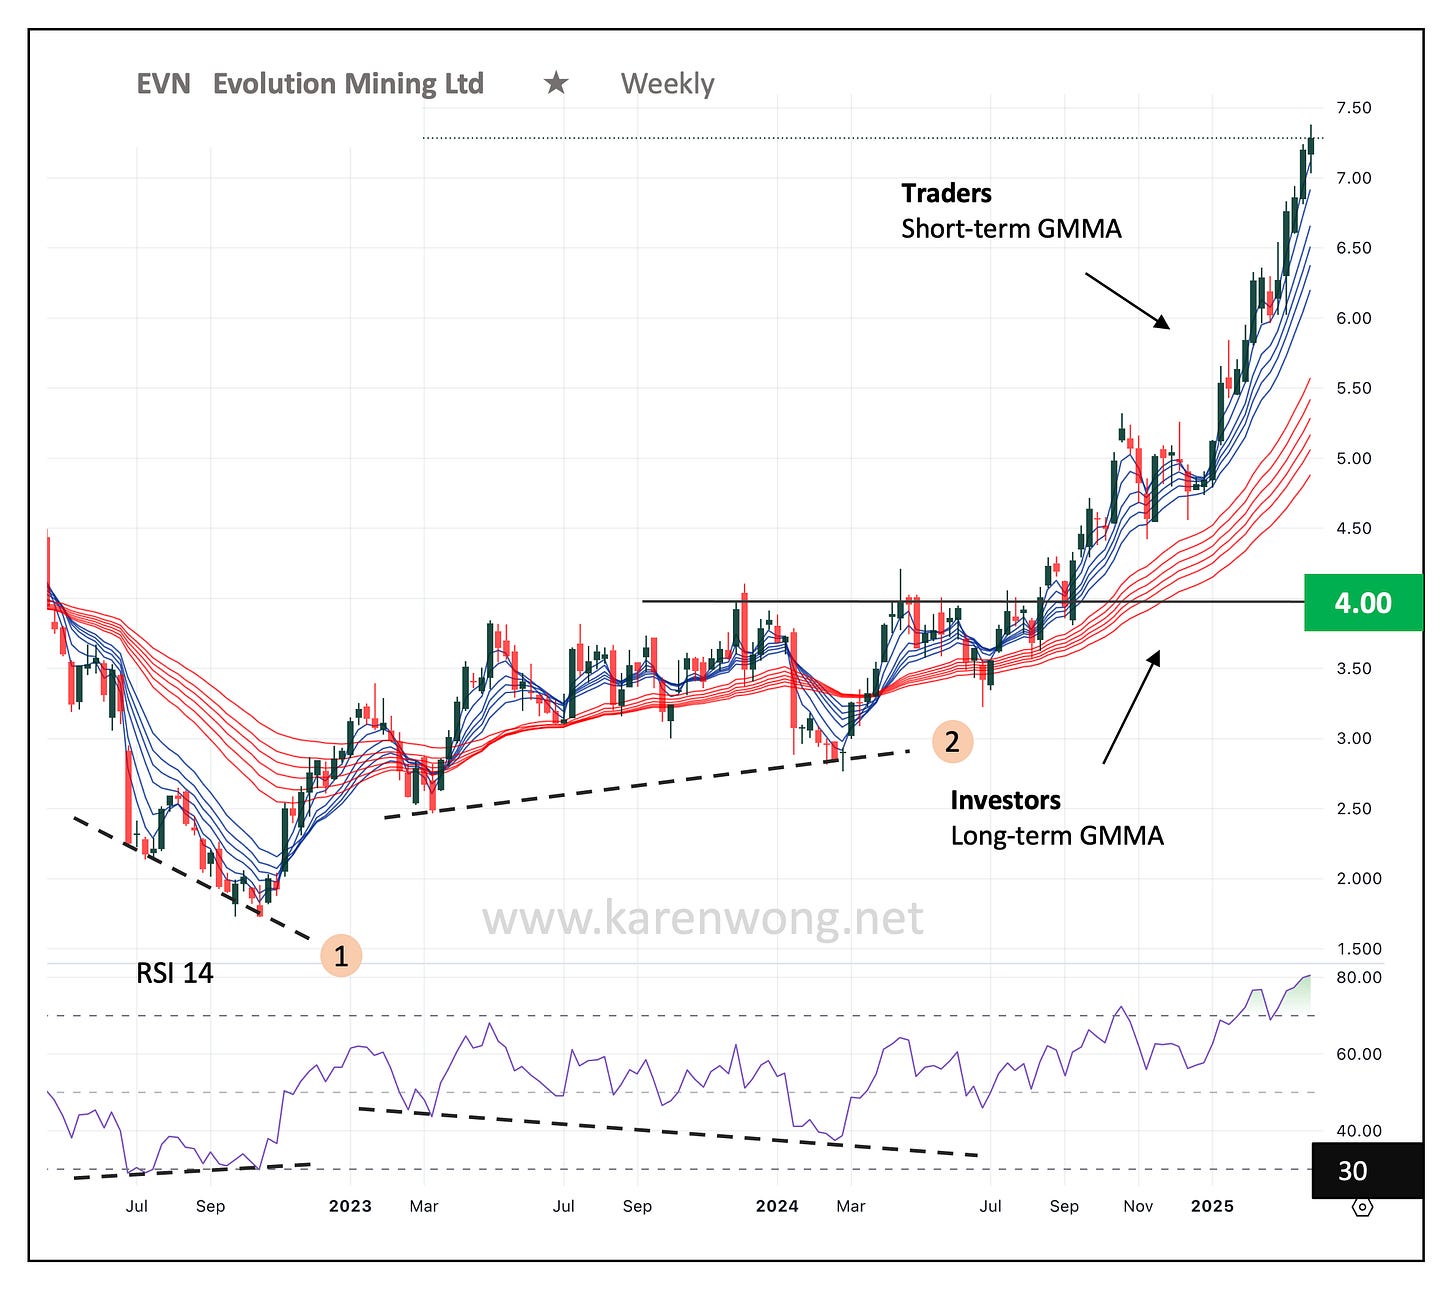
EVN Evolution Mining – Recognising trend strength
The downtrend of EVN turned around in 2023 at the point of an RSI bullish divergence (labelled at 1). Price made a lower low at the same time the RSI indicator made a slightly higher low.
This was a high-risk entry point as the short-term GMMA was attempting to pass through the long-term GMMA. Although the GMMA did manage to develop into an uptrend, the trend was weak with moving average lines narrowly separated, indicating some agreement in price amongst traders and investors.
Around March 2024, when the gold uptrend became stronger, another RSI bullish divergence (labelled at 2) saw price attempt another push back to a GMMA uptrend order. Price broke resistance at 4.00 and the uptrend became more obvious resulting in a higher probability trade opportunity.
RMS Ramelius Resources – Dips with high probability recovery
RMS ended its downtrend order in March 2023. The uptrend order emerging soon after had a weak foundation as the long-term GMMA lines were narrowly separated. Traders sold down the stock at the beginning of 2024.
By March 2024, a bullish RSI divergence had formed. Price made a higher low while the RSI made a slightly lower low. This price dip presented a buy opportunity, confirmed as price recovered off the lower edge of the long-term GMMA. Traders ended the selloff and the short-term GMMA lines expanded upwards.
Each dip in the trend had a high probability of a bounce based on the foundation of good support from investors as indicated by the well separated moving average lines of the long-term group.
Where is gold heading in 2025?
The weekly gold chart currently shows a strong trend supported by both short-term and long-term holders. Price is in overbought territory, signalled by the green shaded area of the RSI. A pullback to some degree is expected over the short-term.
Predicting how long the gold run will last is hard to do with certainty. Given the seasonality chart of gold, we see price in 2025 (the blue line) following a similar pattern to the previous years of 2023 and 2024.
Gold AUD Seasonality 2023 – 2025
If gold continues its past seasonality pattern, we may see some further rise followed by a pullback for a few months and rising prices again.


