


Confirming a Profitable Exit


Reaching our profit target doesn’t necessarily mean the end of a trade. Taking the profit in front of us is not always easy. We may want to wait and watch for further upward momentum, but if the price doesn't move up as expected and starts to fall, we must either take the profit or hold through the volatility. In such situations, an early red flag signal given by the Heikin-Ashi indicator may be useful for confirming the decision to exit over holding the trade position open.
Let’s take a look at this past ASX trade on Black Cat Syndicate – BC8.

Strong Trend Identified
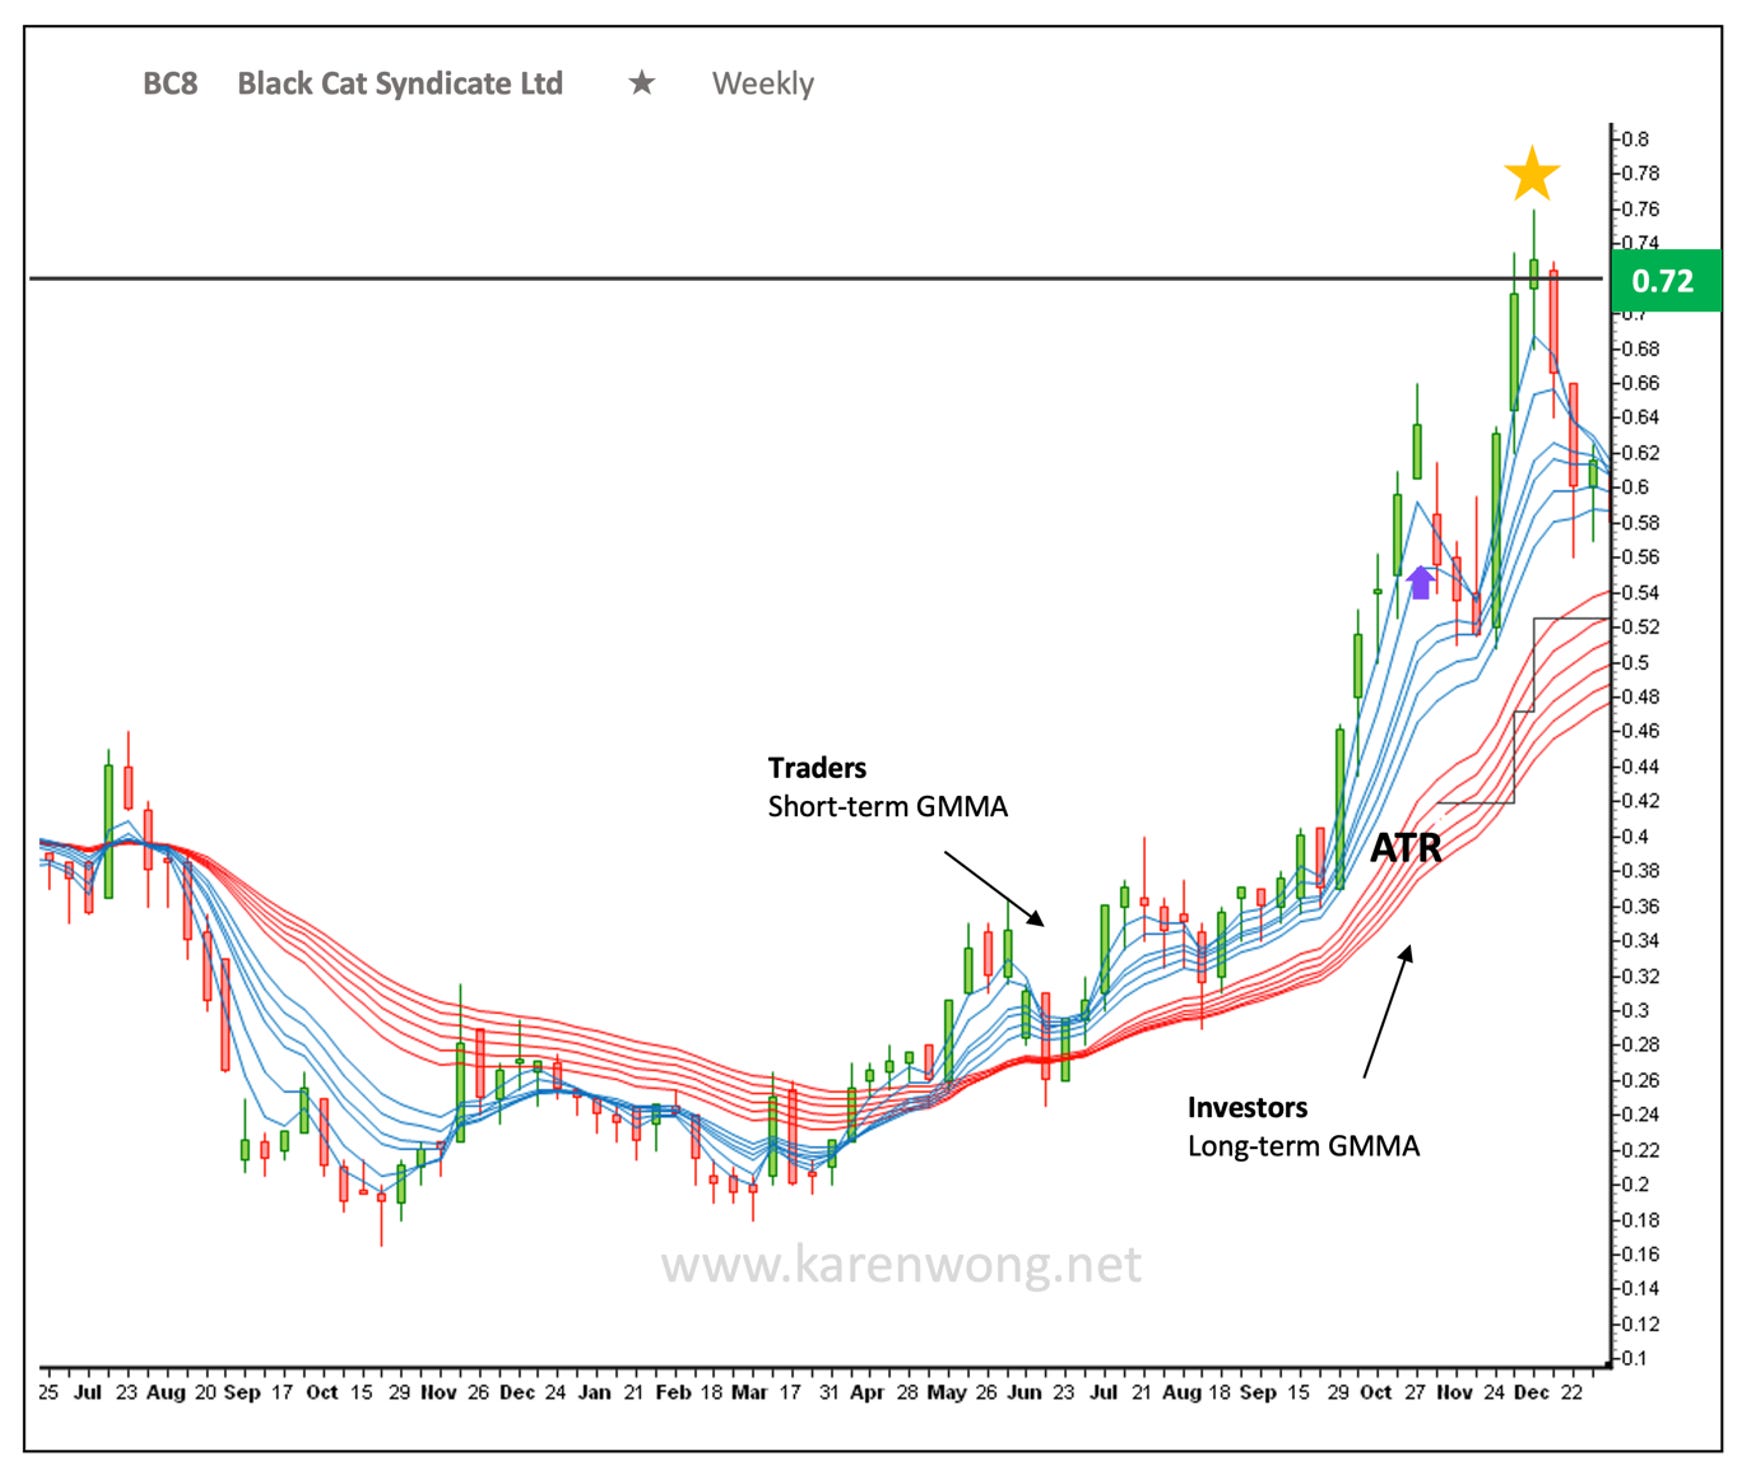
📈 GMMA uptrend was in place where the short-term group was above the long-term group.
🔵 Support from short-term traders was indicated by the widely spaced lines in the short-term GMMA
⬆️ Good support from investors was indicated by the separation of the EMA lines in the long-term GMMA
🔥 Gap between the two groups showed some strength in the uptrend
The weekly chart appeared over extended but a quick check of the daily (not shown) showed price had pulled back in an area where a u turn back to the upside was possible.
Position Opened
🎯 Target Profit 0.72
❇️ Entry at 0.56 marked by arrow
🛑 Stop Loss at ATR 0.42
Tracking the Trade
Price fell after the trade was opened and the u turn didn’t happen until a few weeks later. As long as price did not trigger the trailing ATR stop loss line, the trade remained open.
Entry is marked by the arrow. After a dip to the lower edge of the short-term GMMA, trader selling stopped and trader buying pushed price up for the next few weeks.
Profit Target achieved
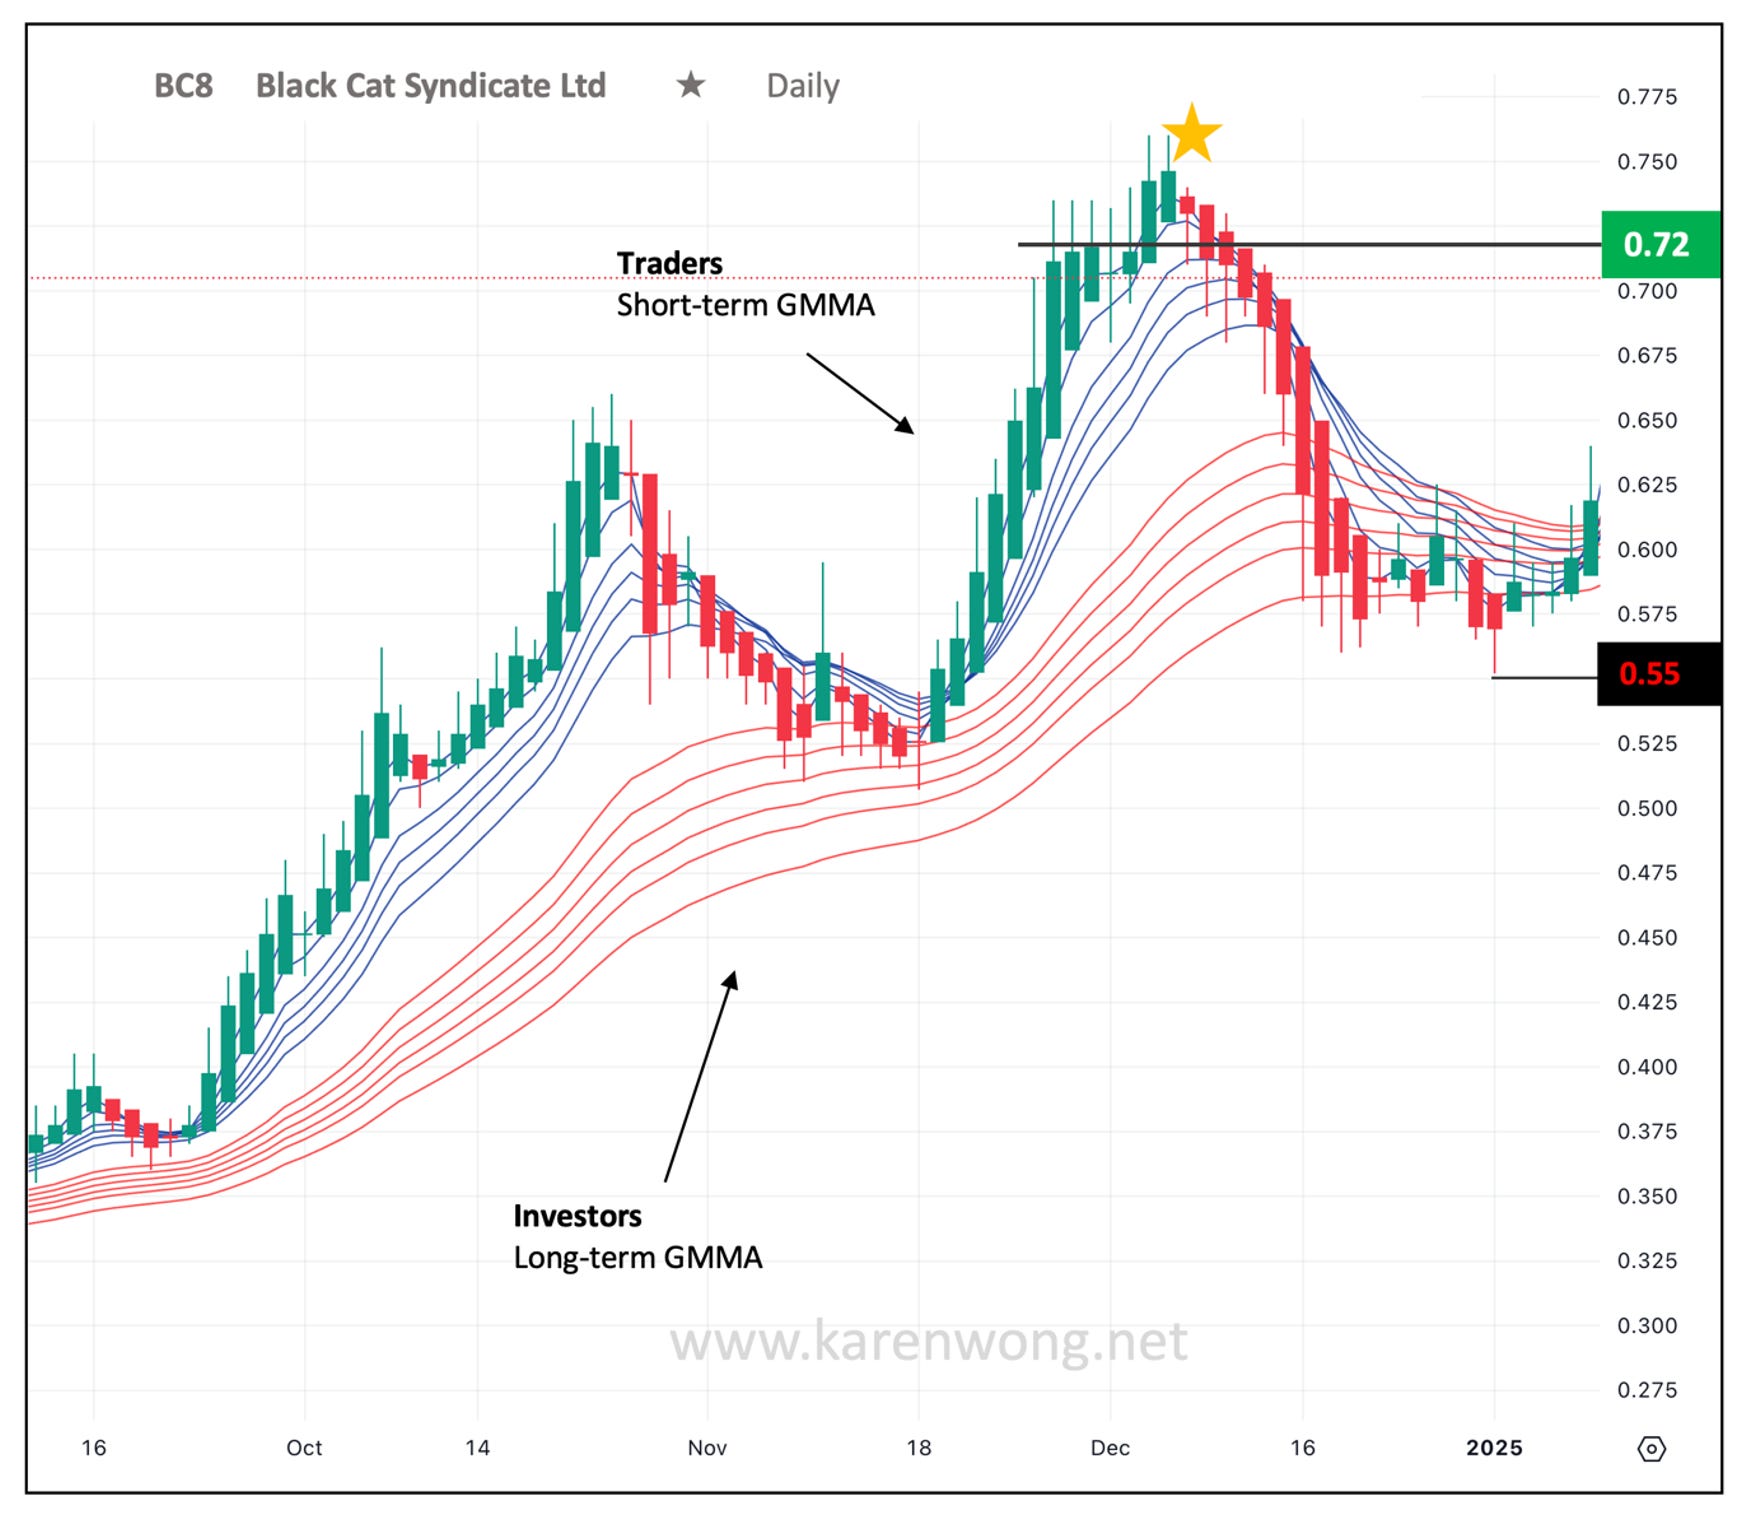
On the second last day of the week, the Profit target of 0.72 had been achieved.
My trade plan states waiting for a Friday end of week close before making any decisions to close a trade position based on the weekly.
A change on the daily Heikin-Ashi candle chart made me think again.
On the daily chart, a red Heikin-Ashi candle had formed indicating a change in the trend from up to down.

Noticing a red Heikin-Ashi candle form on the daily chart was a red flag alert. Heikin-Ashi red candles represent a downtrend while green candles represent an uptrend. Zooming in on the daily for extra information and seeing the trend change was a signal for seriously considering closing the trade.
Instead of holding on for the next week a decision was made towards the end of Friday’s session to lock in the profit.
Closing Position
Based on this information, the trade was closed at 0.725 as marked by the star.
Post Trade
The day after the position was closed, more red Heikin-Ashi candles followed. Price continued to fall to an intraday low of 0.55 on the daily chart. Back to the original entry price. Traders continued selling down the stock and the short-term group turned downwards, passing over the long-term group. The uptrend was almost broken but managed to stay intact. Price consolidated and moved sideways.
Back to the weekly chart, we see the drop from the high of 0.76 to the low of 0.55. Giving back 28% of the original profit target of 30% was a hard to stomach ride down for any trader.

Overall, the uptrend in place was still strong and the gap between the 2 groups signalled a strong uptrend. For any traders still on the rollercoaster of BC8 there was another opportunity to ride another potential leg up again.